Low-Wage Workers
Context
This project examines the extent to which Seattle’s $15 minimum wage policy affected low-wage workers on several dimensions - residential displacement, housing burden, and commute burden. The first step we needed to take to answer this question was to define and operationalize low-wage workers. There are several theories concerning what constitutes a low-wage worker. For example, previous minimum wage studies have used a $13 cutoff. Further, advocacy groups, such as Dismantle Poverty in Washington suggest a person living in Washington making less than or equal to 200% more of the federal poverty line is considered low-wage. For our analysis, we decided to adapt Jardim et al., 2017 $19/hour cutoff for 2015 as a benchmark. To account for inflation, we doubled the Washington State minimum wage from 2010 to 2016.
We determined the low-wage worker variable by summing individuals’ total wages and hours worked (including if they had multiple places of employment) and dividing their total wages by their total hours worked to determine their hourly wage. Next, we created a low-wage variable that marked an individual as low-wage if they made less than two times the Washington State minimum wage for that year or not low-wage if they made two times the Washington State minimum wage or more.
Preparing Data
Below is an example of the code we used to create the low-wage variable
library(dplyr)

# Create new variables for individuals who have multiple jobs
esd_2010_17 <- esd_2010_17 %>%
group_by(uniqueid) %>%
mutate(totalhours = na_if(totalhours, 9999),
totalwages_sum = sum(totalwageamount),
totalhours_sum = sum(totalhours))

# Determine hourly Wage
esd_hourly <- esd_2010_17 %>%
filter(total_hours != 0, totalhours_sum) %>%
mutate(hourlywage_sum = totalwages_sum/totalhours_sum,
hourlywage = totalwageamount/totalhours)

# Create Low-wage Variable for people making less than twice WA min wage
esd_hourly %>%
mutate(low_wage =
if_else(year == 2010 & hourlywage_sum >= 8.55*2, 0,
if_else(year == 2011 & hourlywage_sum >= 8.67*2, 0,
if_else(year == 2012 & hourlywage_sum >= 9.04*2, 0,
if_else(year == 2013 & hourlywage_sum >= 9.19*2, 0,
if_else(year == 2014 & hourlywage_sum >= 9.32*2, 0,
if_else(year == 2015 & hourlywage_sum >= 9.47*2, 0,
if_else(year == 2016 & hourlywage_sum >= 9.47*2, 0))))))))
Visualizations
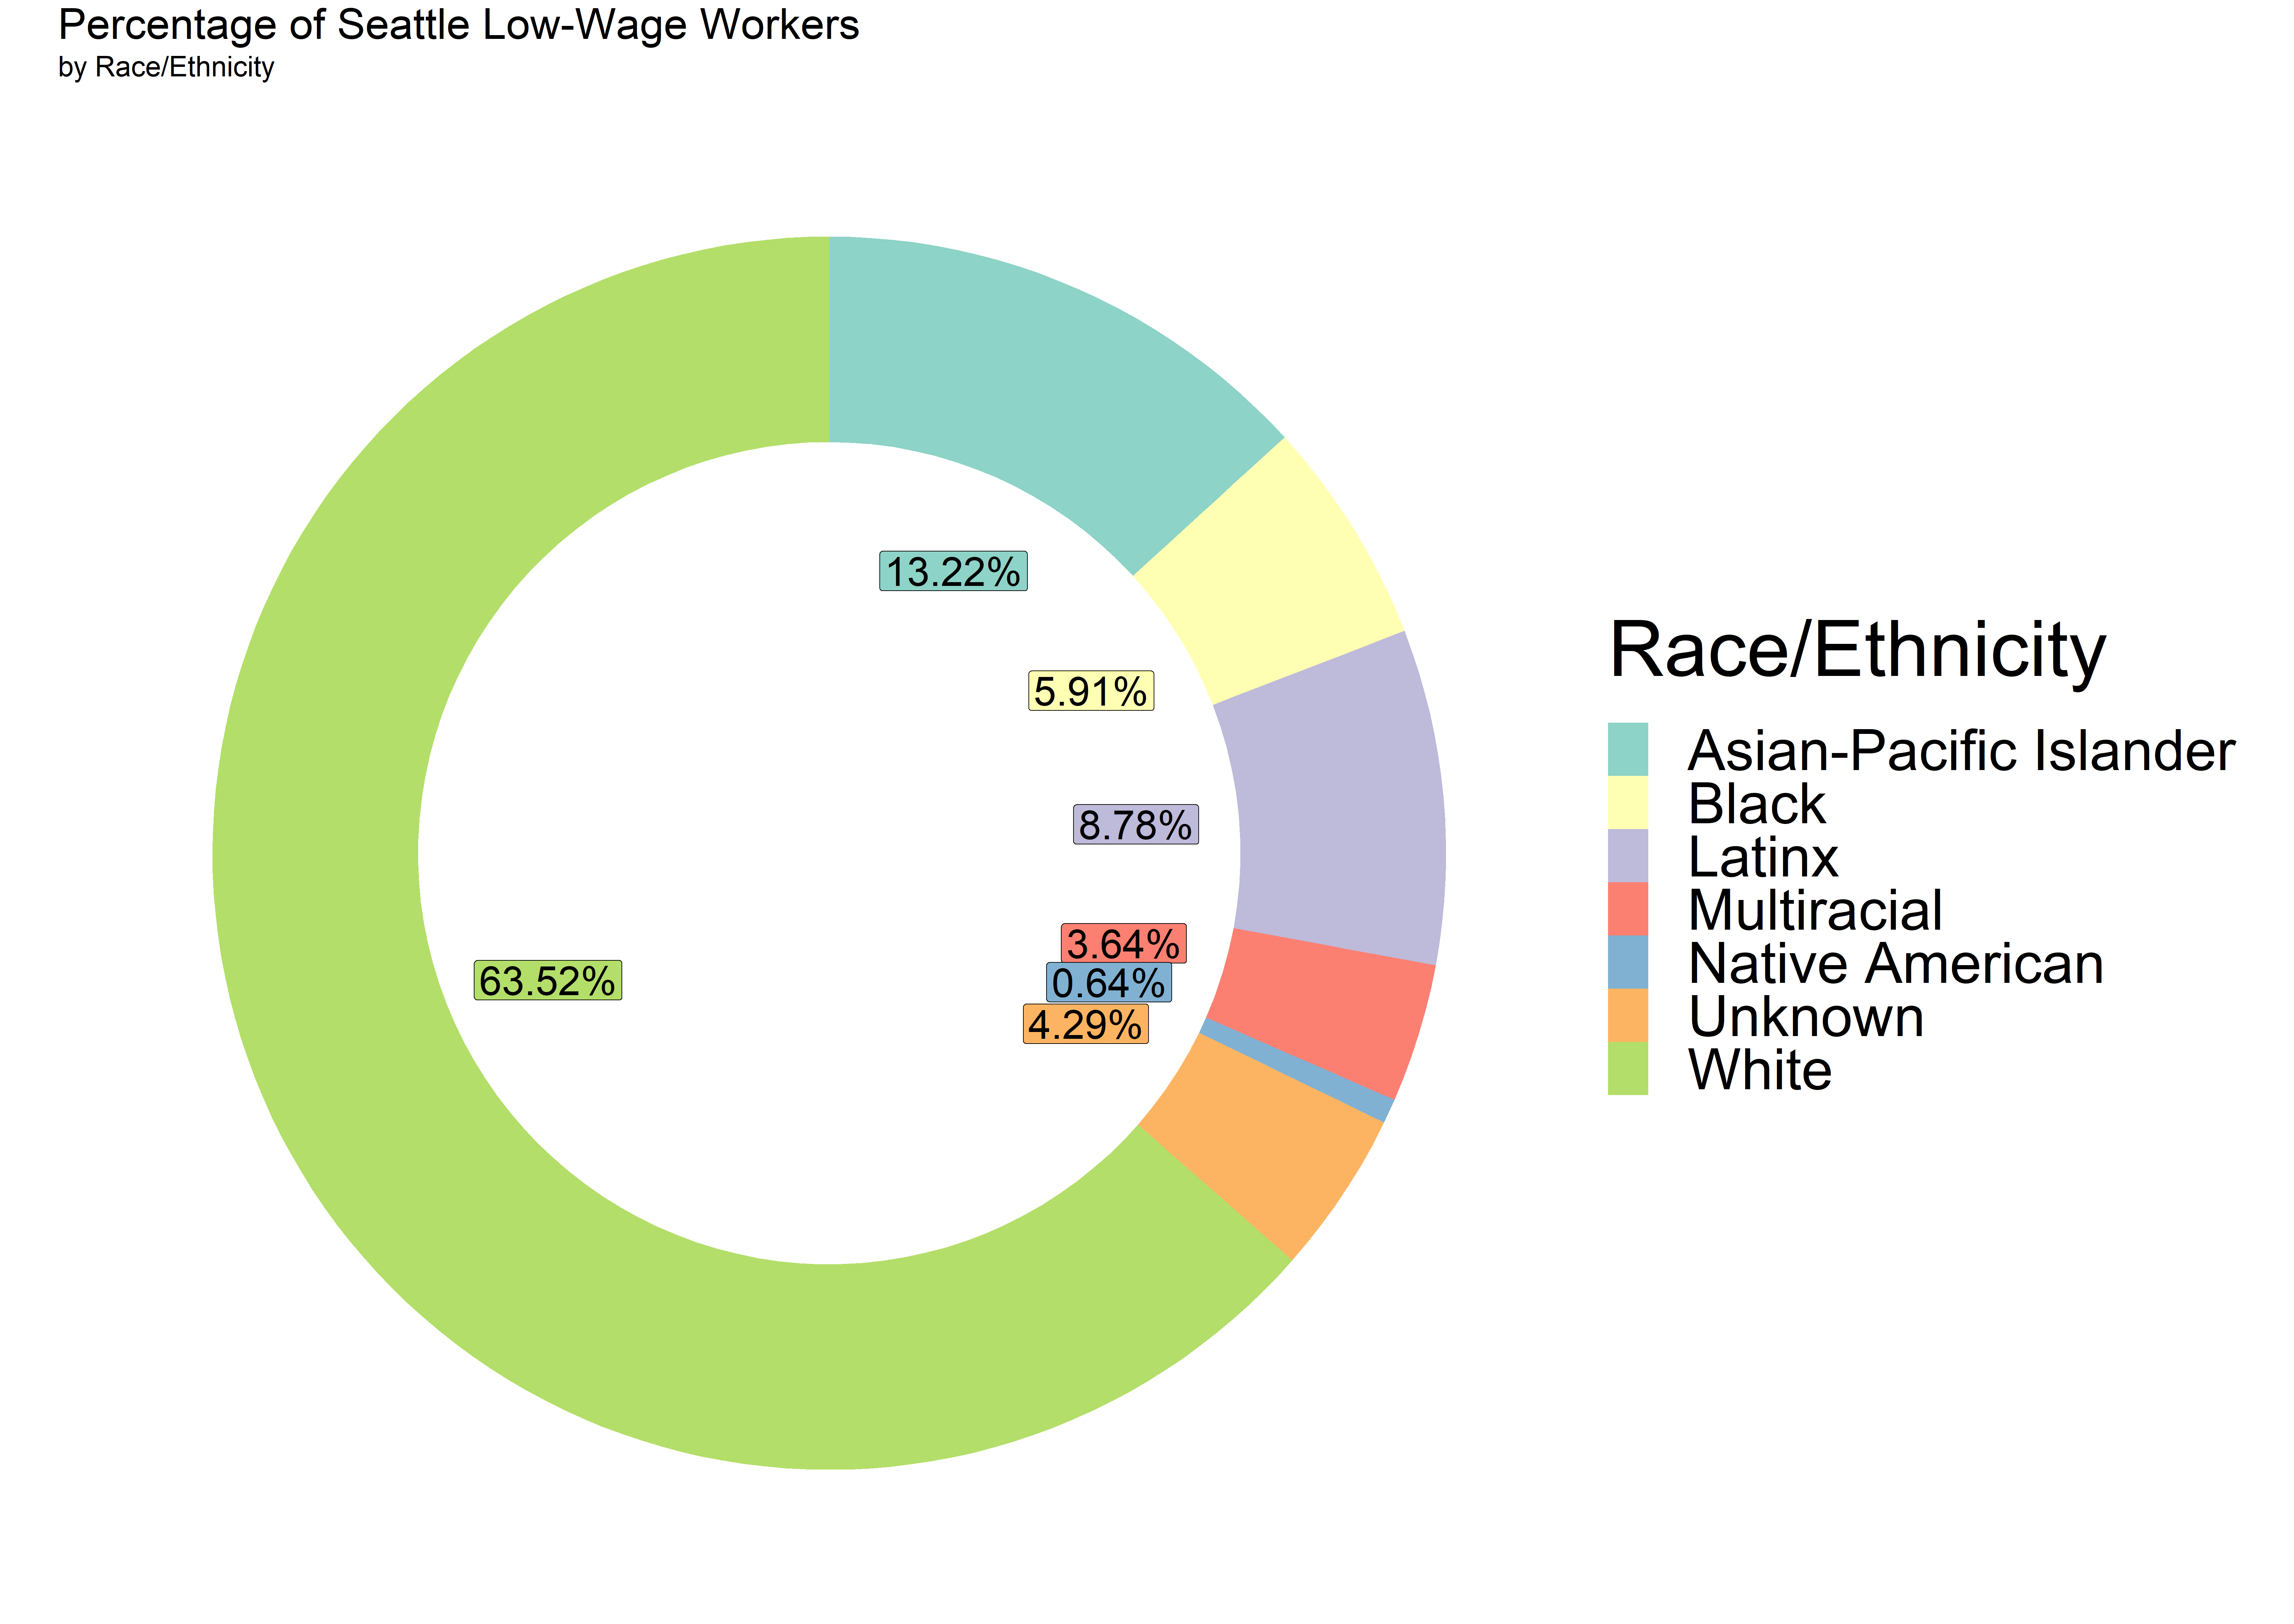
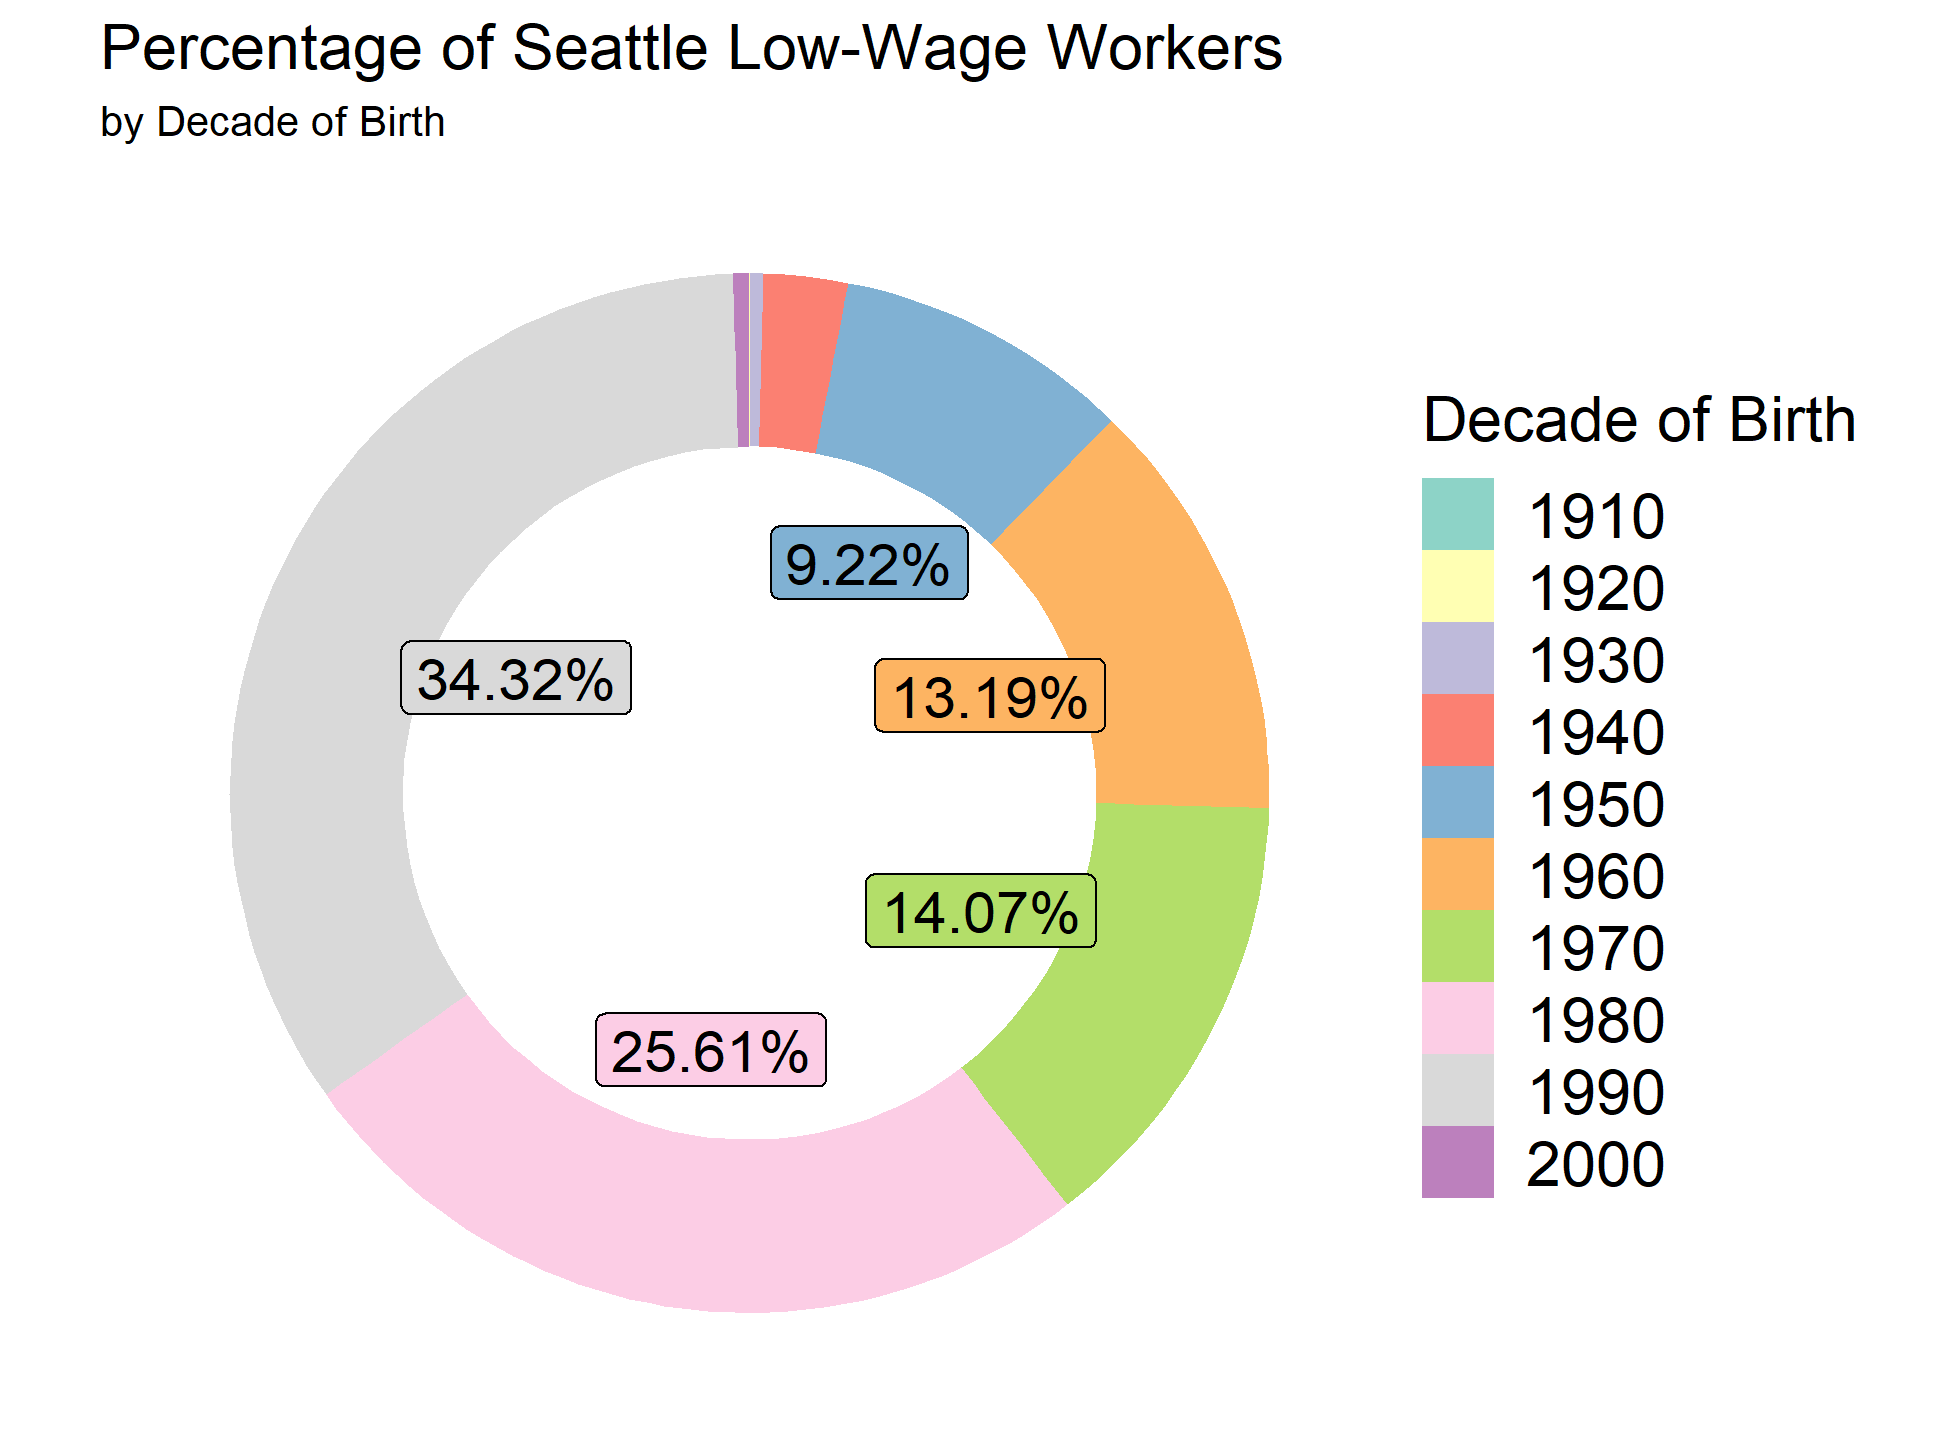
The first visualization below indicates that the percentage of low-wage Seattle workers is proportionate to the Puget Sound region racial demographics (majority White). The second visualization is of Seattle’s low-wage workers in 2016. The graph illustrates that people born in the ’80s and ’90s make up most of the low-wage Seattle worker population.
From 2010 to 2016, the animated map shows that Seattle’s low-wage workers become more prevalent as the years progress. Additionally, it appears that many of the low-wage workers begin to move from Seattle to the outskirts of King County and beyond.